The central object of this package is a vegaspec, short for “Vega specification”. This can refer to either a Vega or Vega-Lite specification; in our examples, we work almost exclusively with Vega-Lite.
This article will showcase functions that:
- build a vegaspec:
as_vegaspec() - examine a vegaspec:
vw_examine() - convert a vegaspec to JSON:
vw_as_json() - resize a vegaspec:
vw_autosize() - compile a Vega-Lite spec to Vega:
vw_to_vega()
The article ends with some “gotchas” (please contribute more as you find them).
Building
A vegaspec is created using the constructor
as_vegaspec(), which takes a list,
character or a jsonlite json
object.
Vega and Vega-Lite expect JSON. Because it is easier, in R, to work with lists, a vegaspec “lives” as a list, and then is coerced to JSON when rendered as a vegawidget.
Let’s start with a bar-chart example. The data_category
object is a sample dataset included in this package:
library("vegawidget")

spec_category <-
  list(
    `$schema` = vega_schema(),
    data = list(values = data_category),
    mark = "bar",
    encoding = list(
      x = list(field = "category", type = "nominal"),
      y = list(field = "number", type = "quantitative")
    )
  ) %>%
  as_vegaspec()

spec_category
Looking at the structure of spec_category, we see that
the vegaspec S3 class inherits from list.
str(spec_category)## List of 4
## $ $schema : chr "https://vega.github.io/schema/vega-lite/v5.json"
## $ data :List of 1
## ..$ values:Classes 'tbl_df', 'tbl' and 'data.frame': 10 obs. of 2 variables:
## .. ..$ category: chr [1:10] "a" "b" "c" "d" ...
## .. ..$ number : int [1:10] 21 64 23 41 92 52 61 27 34 48
## $ mark : chr "bar"
## $ encoding:List of 2
## ..$ x:List of 2
## .. ..$ field: chr "category"
## .. ..$ type : chr "nominal"
## ..$ y:List of 2
## .. ..$ field: chr "number"
## .. ..$ type : chr "quantitative"
## - attr(*, "class")= chr [1:4] "vegaspec_unit" "vegaspec_vega_lite" "vegaspec" "list"You can use the helper function vega_schema() to
generate the string for the $schema element, which can be
useful if you are writing a vegaspec manually.
Examining
We also have a function, vw_examine(), that you can use
to, well, examine a vegaspec. This is a thin wrapper around the
listviewer::jsonedit() function:
vw_examine(spec_category, mode = "code")You might note that, using str(), the
data$values element of the vegaspec has a column-major
format. In R, data frames are lists of vectors; each of the columns is a
vector. In the Vega framework, data sets have a row-major format. When
rendering, this package converts data-frames automatically to row-major
data.
Sizing
Sizing can be a tricky issue in Vega-Lite.
The first thing to keep in mind is that the default interpretation of
width and height refers to the dimensions of the data rectangle. For
example, we can set width and height of our
example spec:
spec_category_size <- spec_category

spec_category_size$width  <- 300
spec_category_size$height <- 300

spec_category_size
Here, the data rectangle is 300 \(\times\) 300 pixels, according to our specification.
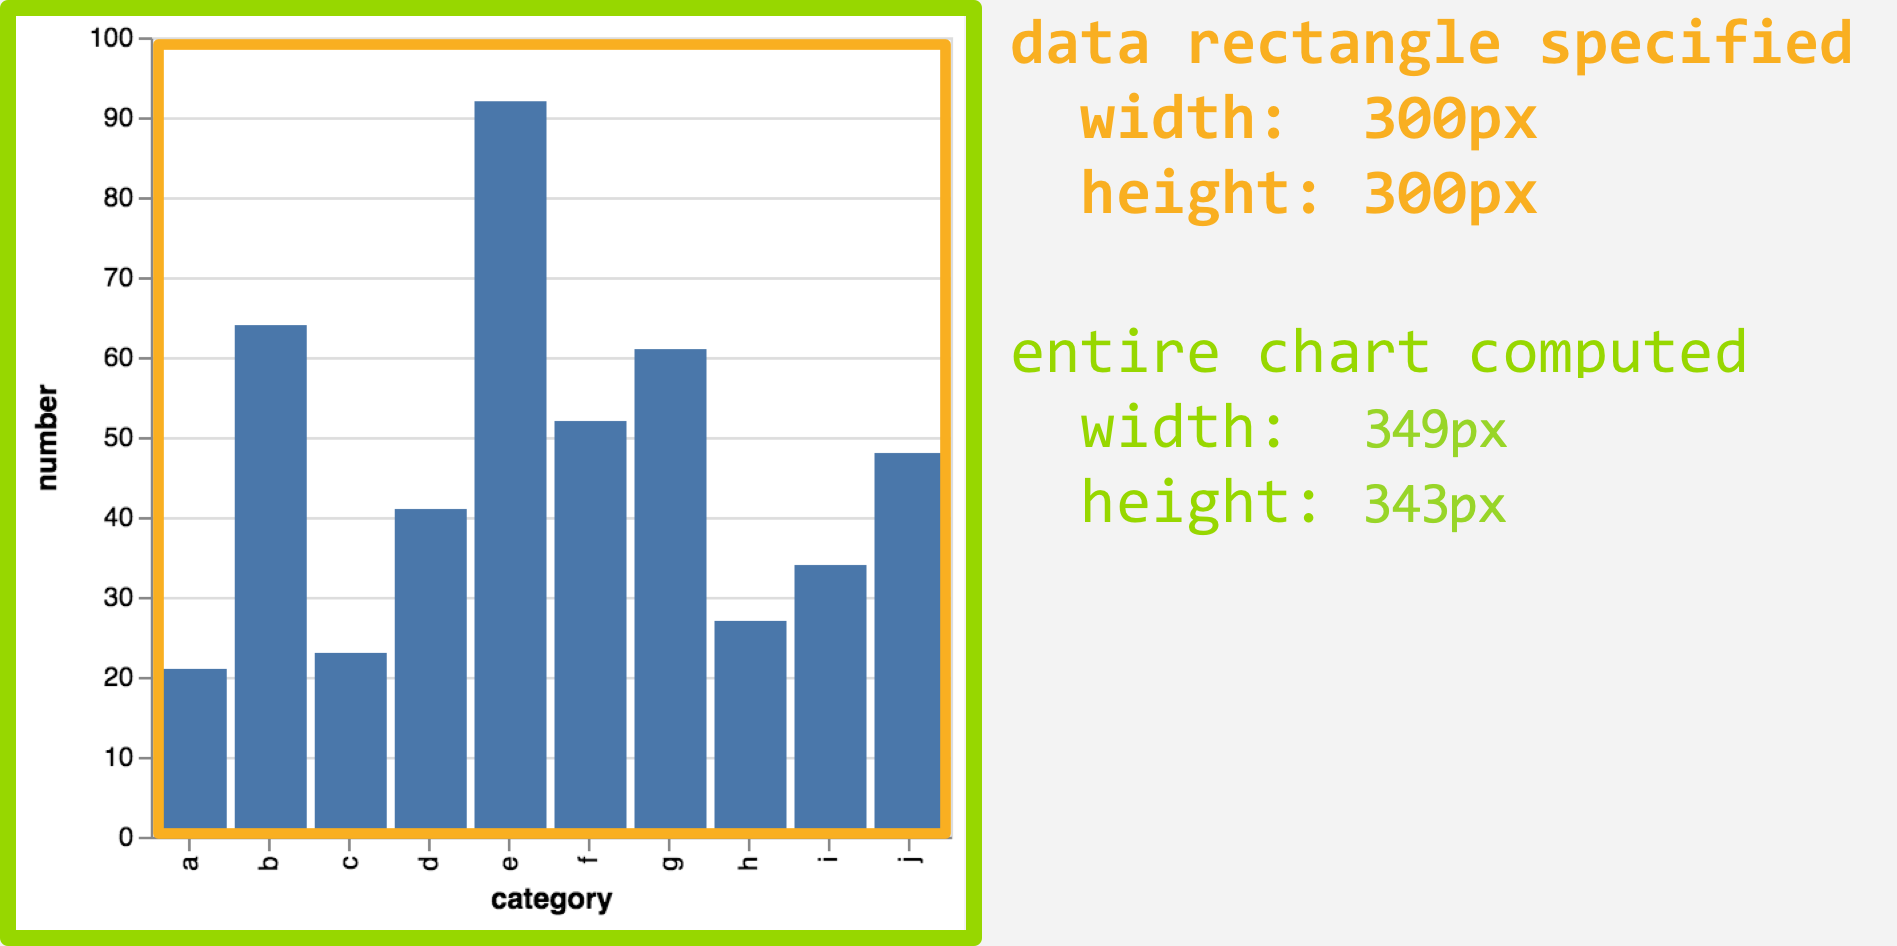
As you can see above, Vega adds on more “room” for axes, labels, legends, etc., so that the entire chart is 349 \(\times\) 343 pixels.
If we want to specify the dimensions of the entire chart, we can use
the vw_autosize() function. The term “autosize” is taken
directly from the Vega documentation
for sizing. In this context, the term “autosize” does
not mean that Vega will try to find the optimal sizing
for your chart.
Instead, it means that if you have a requirement for the dimensions
of the entire chart, Vega will try to adjust the chart to meet these
sizing requirements. The vw_autosize() function modifies
the vegaspec to provide Vega these instructions.
Here’s an example:
spec_category_autosize <-
  spec_category %>%
  vw_autosize(width = 300, height = 300)

spec_category_autosize
In this context, the width and height are
defined as the dimensions of the entire plot including axes, labels,
padding, etc. Here, we have specified the overall dimensions to be 300
\(\times\) 300 pixels:
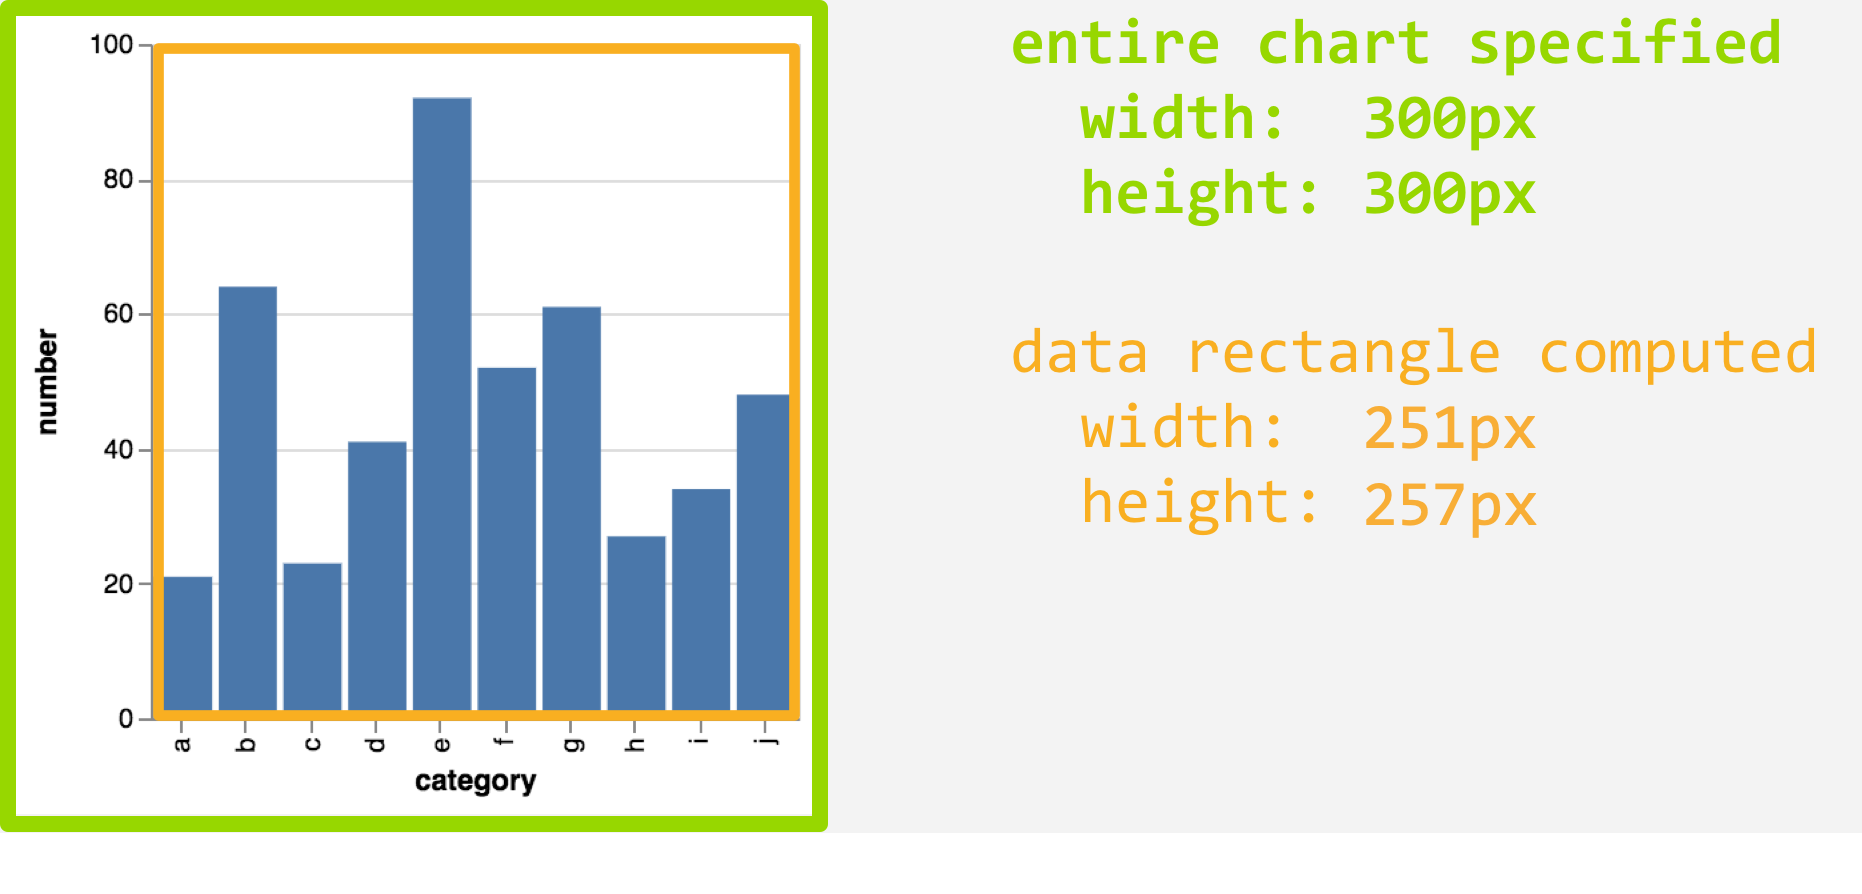
As you can see above, Vega takes into account the “room” needed for axes, labels, legends, etc., so that the data rectangle is 251 \(\times\) 257 pixels.
There are limitations to autosizing; the most prominent is that
specifying width and height is effective
only for single-view and layered specifications. It will not work
for specifications with multiple views (e.g. hconcat,
vconcat, facet, `repeat`); there
will be no effect on the rendered chart.
For more information, see the Vega-Lite documentation on autosizing.
Compile to Vega
When rendering a Vega-Lite specification, the vega-lite JavaScript
library will compile the Vega-Lite specification into Vega. If you have
the V8
package installed, you can compile a Vega-Lite specification to Vega
using the vw_to_vega() function.
To be clear, if you are using only Vega-Lite, this is not something you should ever need to do. This may be useful if you need to design a specification using Vega, and you want get things started using a Vega-Lite specification.
spec_category_vega <- vw_to_vega(spec_category)

spec_category_vega
We can use the vw_spec_version() function to check the
version of the specification:
vw_spec_version(spec_category_vega)## $library
## [1] "vega"
##
## $version
## [1] "5"You can examine the result to see how much-more verbose is the Vega specification, compared to the Vega-Lite specification.
vw_examine(spec_category_vega, mode = "code")Gotchas
There are a few things to keep your eyes open-for if you are building vegaspec:
If the JSON needs a
null, supply aNULLfrom R.If the JSON needs an element called
repeat, keep in mind that this is a reserved word in R. You can specify such an element using backticks, e.g.list(`repeat` = ...).